We now return to the White Mountains. To illustrate the application
of detrital thermochronology to quantitative geomorphology, consider
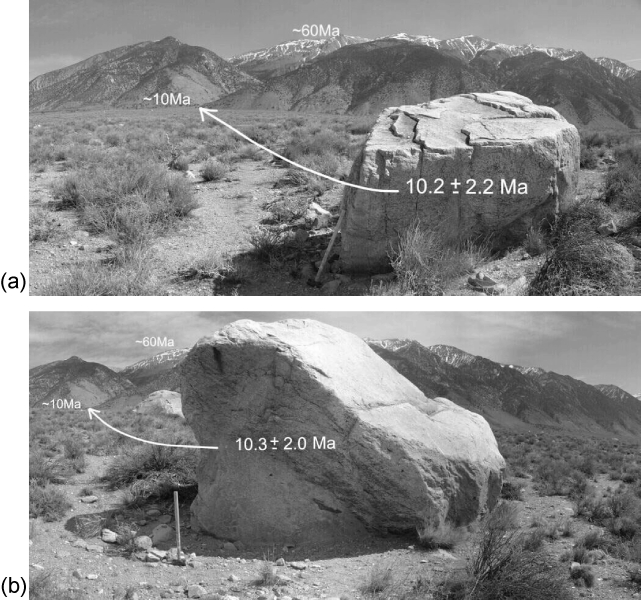
granitoid (quartz monzonite) boulders A and B (Figure
5) on the alluvial fan that is fed by the Marble
Creek drainage. Large boulders of several meters diameter are a
characteristic feature of the alluvial fans of the northern Owens
Valley (e.g., Figure 16 of Beaty, 1963). They can be found up
to several kilometers from the range front and are evidence of the
exceptional power of the rare flash floods and debris flows that are
responsible for the bulk of sediment transport on the Marble Creek
alluvial fan [Beaty, 1963]. The Marble Creek catchment area is
15.82 km![]() , 14.01 km
, 14.01 km![]() of which consist of quartz monzonite, with
only a small portion of Paleozoic marble (Figure 2).
Boulders A and B both have an AFT age of 10
of which consist of quartz monzonite, with
only a small portion of Paleozoic marble (Figure 2).
Boulders A and B both have an AFT age of 10![]() 2 Ma, indicating that
they were derived from the base of the range (Figure
5). This method is easily extended to samples of
many, rather than one clast. Sand sample C was collected at the apex
of the alluvial fan (Figure 2). If erosion is assumed
to be uniform across the entire Marble Canyon, then we can calculate a
predicted age distribution by exhaustively sampling all the pixels of
the digital elevation model (Figure 1) and predicting
their respective expected AFT cooling ages.
2 Ma, indicating that
they were derived from the base of the range (Figure
5). This method is easily extended to samples of
many, rather than one clast. Sand sample C was collected at the apex
of the alluvial fan (Figure 2). If erosion is assumed
to be uniform across the entire Marble Canyon, then we can calculate a
predicted age distribution by exhaustively sampling all the pixels of
the digital elevation model (Figure 1) and predicting
their respective expected AFT cooling ages.
|
Previous studies [Stock and Montgomery, 1996; Brewer et
al., 2003; Ruhl and Hodges, 2005] assumed that exhumation is
laterally continuous and uniform. In this case, the expected detrital
age distribution can be calculated by simply convolving the
age-elevation curve with the hypsometry. In the case of the White
Mountains, however, it is known that the assumption of uniform
exhumation does not hold, and that ![]() 25
25![]() of eastward tilting
has taken place since the late Miocene [Stockli et al., 2003].
Therefore, paleo-isotherms are not horizontal, and the simple
hypsometric approach is not valid.
of eastward tilting
has taken place since the late Miocene [Stockli et al., 2003].
Therefore, paleo-isotherms are not horizontal, and the simple
hypsometric approach is not valid.
Relatively little material will be derived from the lower elevations
or higher paleodepths, because the basin is the narrowest at its mouth
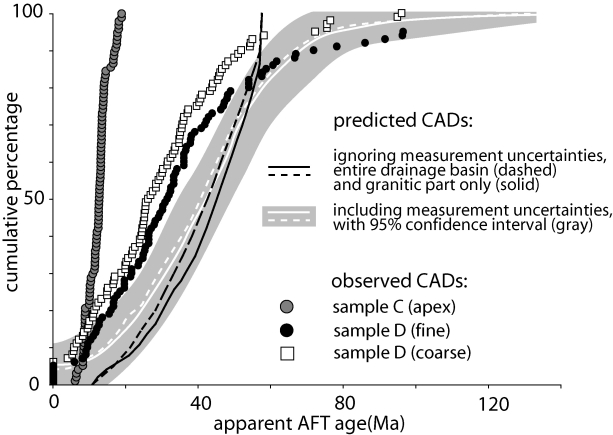
(Figure 2). The CAD (Figure 6) serves
as a proxy for the age-elevation curve of the basement, defined by
Figure 1.a. ``Steep'' parts of the age-elevation
curve are defined by elevation intervals over which the AFT ages are
approximately constant (Figure 1.a). These ages will
be over-represented in the grain-age distribution and correspond to
steep parts of the CAD. Likewise, relatively flat portions of the
age-elevation curve correspond to intervals of the basement over which
the AFT ages change rapidly with elevation. These ages will be
under-represented in the detrital grain-age distribution and
correspond to relatively flat parts of the CAD. Marble Creek
sediments only sample ages corresponding to the lower part of the
basement age-elevation curve. Older ages can be found in sediments on
the eastern side of the mountain range (Figure 1).
|
The predicted CAD shown in black on Figure 6 assumes
zero measurement uncertainties. According this curve, the youngest
expected detrital AFT grain-age should be 12Ma, or 10Ma taking into
account the measurement uncertainties reported by Stockli et al.
[2000]. However, the observed CAD is not computed from composites of
many apatites, as in Stockli et al. [2000] and Figure
1.a, but on individual AFT grain-ages, which have
much larger uncertainties that are governed by a Poisson distribution.
Using the database of measured ![]() ,
, ![]() and
and ![]() values provided in the auxiliary material, Section 2.4
explained how to compute an equivalent predicted CAD that accounts for
these uncertainties (the white curve in Figure 6).
values provided in the auxiliary material, Section 2.4
explained how to compute an equivalent predicted CAD that accounts for
these uncertainties (the white curve in Figure 6).
Apart from the measurement uncertainties inherent to the fission track
method, additional uncertainty is introduced by the finite sample
size, 97-100 apatite grains for this study. This ensures us that the
largest population fraction that was not missed with 95% probability
is less than 6% of the total [Vermeesch, 2004]. 5000 random
replicates of the predicted CAD were generated by repeatedly sampling
97-100 times from the predicted age distribution (white curve of
Figure 6), and selecting the 4750 replicates that
yielded the smallest Kolmogorov-Smirnov (K-S) statistic [ Conover, 1999] when compared to the predicted CAD (solid black line
in Figure 6). Thus, the gray confidence band around
the predicted CAD of Figure 6 represents the
statistical uncertainty of the observed CADs. Please note that we just
use the K-S statistic and not the K-S test. The K-S
statistic is the largest vertical distance between two CDFs. Based on
this statistic, Kolmogorov [1933] and Smirnov [1939, 1948]
devised a test to decide whether or not sampling statistics alone
could be responsible for the difference between two distributions.
This test does not account for the measurement uncertainties of the
data. However, this is irrelevant to the extent that only the K-S
statistic, and not the actual K-S test is used for calculating the
confidence band of Figure 6.
The studies of Brewer et al. [2004] and Ruhl and Hodges [2005] were located in a very remote and challenging Himalayan field area, with relatively poorly known lithology and structural geology. Because these conditions made it very hard to assess the potential impact of non-uniform lithology and differential exhumation, these factors were not discussed in much detail. Ruhl and Hodges [2005] list non-uniform lithology and differential uplift under their assumption 2. They argue that if the observed CAD matches the hysometry, this can be seen as evidence for the validity of these assumptions. In contrast with these previous studies, the White Mountains in general, and the Marble Creek drainage in particular provide an excellent testing ground for the CAD method, because both structure and lithology are simple. Nearly the entire catchment is underlain by a single pluton, the Pelissier Flats monzo-granite, which is bounded to the West by a single normal fault, but remains unaffected by faulting elsewhere. One potentially important lithological inhomogeneity are the mylonites of the Cretaceous White Mountain shear zone [Stockli et al., 2003]. As a first-order test of relatively uniform composition, note that all the Pelissier Flats samples of Stockli et al. [2000, 2003] yielded abundant apatite. A small but significant part of the canyon is Paleozoic marble [Crowder et al., 1972; Figure 2] that contains no apatite and will not contribute to the CAD. The dashed lines on Figure 6 were calculated assuming a uniform lithology with uniform apatite concentration. The two solid lines on Figure 6 show the equivalent predicted CADs excluding the marble outcrop; their difference illustrates the sensitivity of the CAD to lithological inhomogeneity, which appears to be only moderately important.