In the toy example discussed before, all measurements had equal
measurement uncertainties. This is seldom the case in real world
applications, particularly when fission track dating is involved.
Most importantly, AFT age uncertainties are a sensitive function of
the number of spontaneous fission tracks. Young grains have fewer
spontaneous tracks than older grains of similar U-concentration. This
results in widely variable measurement uncertainties ranging from a
few percent for old, U-rich grains to more than 100% for U-poor
grains containing little or no fission tracks. As explained in the
previous section, measurement uncertainties are incorporated in the
predicted, rather than the observed CAD. The problem of unequal
measurement uncertainties can be mitigated by using Brandon's
[1996] logarithmic ``z-transformation'' (Equation 3).
Although this is a valid approach, we will use the regular
age-equation in the following.
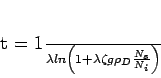
The sand and gravel samples discussed in this paper were dated with the external detector method [Hurford and Green, 1983]. The age equation for this method is:
with all variables as in Equation 3. Using the external
detector method, fission track ages (t) are roughly proportional to
the ratio of the expected number of spontaneous tracks (N![]() ) in the
mineral grain to the expected number of tracks induced by neutron
irradiation (N
) in the
mineral grain to the expected number of tracks induced by neutron
irradiation (N![]() ): t
): t ![]() N
N![]() /N
/N![]() . However, if N
. However, if N![]() and/or N
and/or N![]() are small numbers (
are small numbers (![]() 10), then the observed ratio
of spontaneous (
10), then the observed ratio
of spontaneous (![]() ) to induced (
) to induced (![]() ) tracks can
potentially be very different. For example, if N
) tracks can
potentially be very different. For example, if N![]() =2, there is 14%
chance that
=2, there is 14%
chance that ![]() =0, resulting in an AFT age
=0, resulting in an AFT age
![]() = 0. Assuming that there is no
systematic correlation between N
= 0. Assuming that there is no
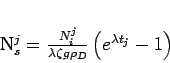
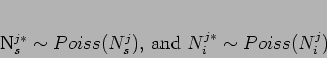
systematic correlation between N![]() and t, the effect of
Poisson-distributed counting statistics on the CAD can be modeled as
follows:
and t, the effect of
Poisson-distributed counting statistics on the CAD can be modeled as
follows: