Equations 2-6 can be used to calculate (U-Th)/He ages from individual U, Th and He measurements, but do not explain how to calculate the ``average'' value of multiple analyses. Traditionally, the average has been estimated by the arithmetic mean of the single grain ages. This section will introduce two alternative methods for calculating average ages, and the next section will add a third. Each of these new methods is more appropriate than the arithmetic mean age in specific applications.
The pooled age
Helium can be extracted from the host grain either in a resistance
furnace or by laser-heating in a micro-oven (House et al., 2000). In
the former, but sometimes also in the latter case, it may be necessary
to analyze multiple mineral grains together (e.g., Persano et al.,
2007). ``Pooling'' several grains boosts the signal strength and
sometimes averages out ![]() -ejection correction errors caused by
zoning and mineral inclusions. Vermeesch et al. (2007) introduced the
``pooled age'' as the best way to compare multiple single-grain ages
with one or more multi-grain ages, or to compare two sets of
multi-grain ages with each other (Figure 1). The
pooled age is calculated by adding the respective U, Th and He
abundances (in moles) of several measurements together, thereby
generating one ``synthetic'' multi-grain measurement. The age of the
pooled measurement can then be calculated using any of the equations
given in Section 2.
-ejection correction errors caused by
zoning and mineral inclusions. Vermeesch et al. (2007) introduced the
``pooled age'' as the best way to compare multiple single-grain ages
with one or more multi-grain ages, or to compare two sets of
multi-grain ages with each other (Figure 1). The
pooled age is calculated by adding the respective U, Th and He
abundances (in moles) of several measurements together, thereby
generating one ``synthetic'' multi-grain measurement. The age of the
pooled measurement can then be calculated using any of the equations
given in Section 2.
An obvious disadvantage of pooling compositional data is that the resulting age is biased to the high U, Th or He compositions. Because such bias can be associated with anomalous grains affected by radiation damage or implanted helium, the pooled age may be wrong by effectively giving extra weight to outliers. However, all these objections are also true for standard multi-grain analyses, which cannot be avoided when dating small, young, or U-Th-poor grains (e.g., Persano et al., 2007). In short, the pooled age must be used for and only for averaging multi-grain aliquots.
|
(a) 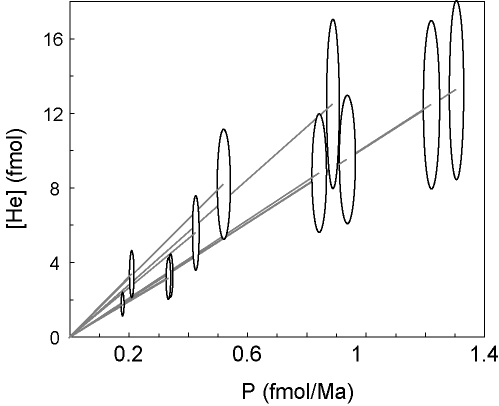 (b)
(b) 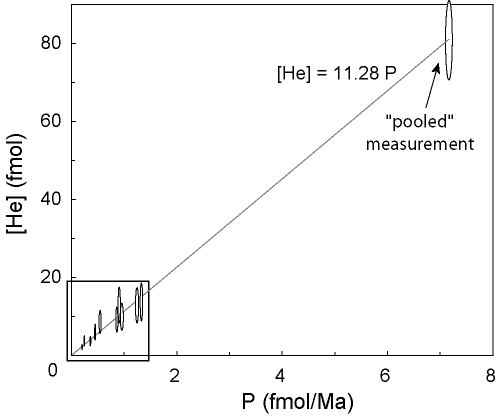
|
The (U-Th)/He isochron
The previous section showed that (U-Th)/He data can be visualized on a
two-dimensional plot of helium abundance or concentration versus
-production (Figure 1). To calculate a pooled age, it
is important that [U], [Th] and [He] are elemental abundances,
expressed in moles. If the data are recast in units of
concentration, some of the bias towards high U-Th-grains disappears
and the He-P diagram can be used to define a (U-Th)/He isochron.
This is an unconstrained linear fit through a series of single-grain
(P,[He]) measurements.
For an application of the isochron method, consider the U-Th rich
mineral inclusions in apatite which are often held responsible for
erroneously old (U-Th)/He ages, because they produce ``parentless''
He. This problem can be detected with the (U-Th)/He isochron. In the
absence of mineral inclusions, the isochron goes through the origin
(P=[He]=0). However, in the presence of ![]() -emitting inclusions,
the isochron is either not defined or does not go through the origin.
For example, consider the worst-case scenario of an
-emitting inclusions,
the isochron is either not defined or does not go through the origin.
For example, consider the worst-case scenario of an ![]() -emitting
zircon inclusion contained in an apatite without U and Th. The
inclusion ejects He into the surrounding apatite that is measured
following degassing by heating with a laser or in a resistance
furnace. However, the zircon inclusion will not dissolve in the
concentrated HNO
-emitting
zircon inclusion contained in an apatite without U and Th. The
inclusion ejects He into the surrounding apatite that is measured
following degassing by heating with a laser or in a resistance
furnace. However, the zircon inclusion will not dissolve in the
concentrated HNO![]() that is commonly used to digest apatites prior to
U-Th analysis. Therefore, the apparent (U-Th)-production of such a
sample is zero, and its isochron does not go through the origin of the
[He]-P diagram.
that is commonly used to digest apatites prior to
U-Th analysis. Therefore, the apparent (U-Th)-production of such a
sample is zero, and its isochron does not go through the origin of the
[He]-P diagram.
Vermeesch et al. (2007) solved the parentless helium problem by
dissolution of the apatite and its inclusions in hot HF. The
effectiveness of this technique is illustrated by comparing an
inclusion-rich sample from Naxos using the traditional HNO![]() method
with an HF-treated aliquot of the same sample. The latter defines a
well-constrained (U-Th)/He isochron with zero intercept, whereas the
former does not (Figure 2). Calculation of the isochron
age, including error propagation, can easily be done using the Isoplot
Excel add-in (Ludwig, 2003).
method
with an HF-treated aliquot of the same sample. The latter defines a
well-constrained (U-Th)/He isochron with zero intercept, whereas the
former does not (Figure 2). Calculation of the isochron
age, including error propagation, can easily be done using the Isoplot
Excel add-in (Ludwig, 2003).
|
(a) 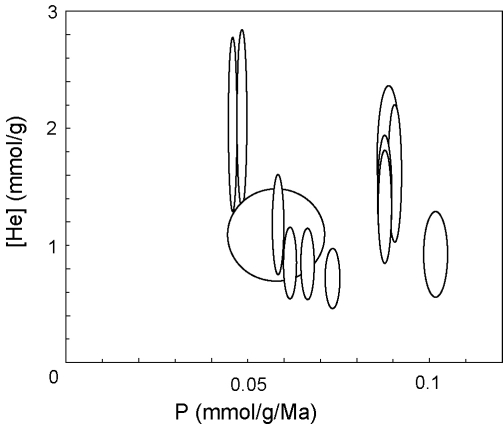 (b)
(b) 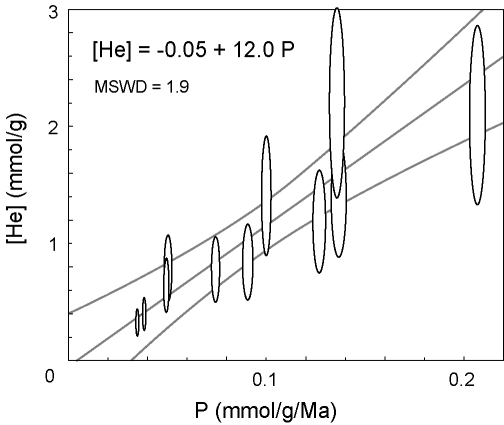
|