Both trees were tested on three suites of samples that had not been used in the tree construction. The test data (electronic annex EA-1) include:
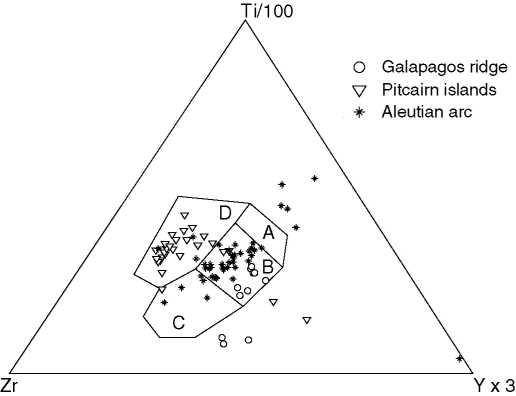
First, these geochemical analyses were classified using the classic
Ti-Zr-Y diagram of Pearce and Cann (1973). The results are shown on
Figure 6 and Table 3. A large
subset of the data could not be classified, because (1) either Ti, Zr
or Y had not been analysed, or (2) because the data do not plot inside
any of the labeled areas of the ternary diagram. A substantial
portion of the remaining data plots in field ``B'' of the
discrimination diagram, which is of mixed tectonic affinity, although
further classification can be done using the Ti-Zr diagram (Pearce and
Cann, 1973). For the samples that plot in fields ``A'', ``C'' and
``D'', the classification seems to be quite successful, although it is
hard to assess the misclassification risk because the number of
``classifiable'' points is so small.
|
It might not seem fair to the discrimination diagram method to only
compare our classification trees with the method of Pearce and Cann
(1973). Although this diagram has great historical significance and is
still used a lot, it suffers from many of the wrong statistical
assumptions that have plagued the analysis of compositional data, and
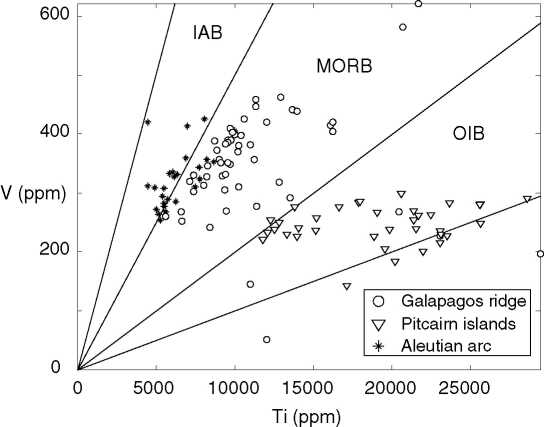
have been discussed elsewhere (e.g., Aitchison, 1986). The Ti-V
diagram of Shervais (1982) largely avoids these problems, because it
only uses two variables, and does not rescale them to a constant sum,
as is the case for the ternary Ti-Zr-Y diagram of Pearce and Cann
(1973). Furthermore, the training data of Shervais (1982) do not
consist of averages of multiple samples, but of individual geochemical
analyses. The Ti-V diagram can distinguish between all three tectonic
affinities, so there is no field of ``mixed affinity'' like field B of
Figure 6. Figure 7 shows the test
data plotted on the Ti-V diagram. Table 4 summarizes
the performance of this classification.
The decision boundaries of all the tectonic discrimination diagrams
discussed so far were drawn by eye. Vermeesch (2006) revisited
these and other diagrams and recalculated the decision boundaries
using the statistically more rigorous technique of discriminant
analysis. Besides revisiting the diagrams of Pearce and Cann (1973),
Shervais (1982) and others, Vermeesch (2006) also performed an
exhaustive exploration of all possible binary and ternary combinations
of 45 elements, based on the same training data used in the present
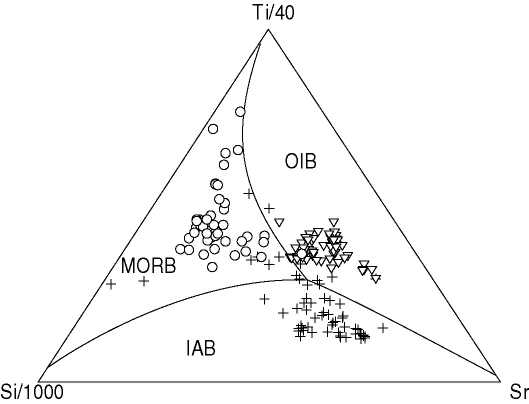
paper. Here, only two of these diagrams will be discussed. The best
overall linear discrimination diagram uses the combination of Si, Ti
and Sr (Figure 8, Table 5). The best
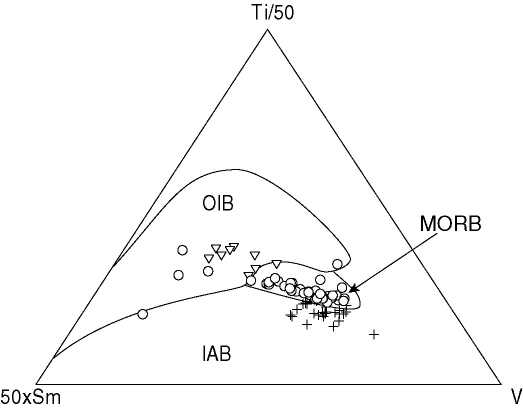
quadratic discrimination diagram of only relatively immobile elements
uses Ti, V and Sm (Figure 9, Table 6).
|
|
The same data were also classified with the trees of Figures
4 and 5. The results of this
experiment are shown in Tables 7 and
8. Contrary to the discrimination diagrams, the
classification trees managed to assign a tectonic affinity to all 182
test samples. The HFS tree misclassifies quite a few more IABs and
MORBs than the full tree. For the MORBs, it is probably not
surprising that 14 out of 54 Galapagos ridge samples were
misclassified as OIBs, considering the possible presence of
plume-ridge interactions near the Galapagos hot spot. The higher
misclassification risk of the HFS tree reminds us of the fact that
unless rocks are obviously altered, it is better to use the full tree,
which includes Sr.
Performance of the Ti-V diagram is remarkably good and comparable to that to the full tree with a misclassification rate of 13/93 for the former and 23/182 for the latter (Tables 4 and 7). The Si-Ti-Sr (17/164 misclassified, Table 5) and Ti-V-Sm (8/85 misclassified, Table 6) diagrams even seem to perform better than the classification trees. However, this is likely to change for new trees created from larger sets of training data. Discriminant analysis does not gain much from excessively large databases, whereas classification trees keep improving. And again, neither the Si-Ti-Sr nor the Ti-V-Sm diagram succeeded in classifying all the test data, in contrast with the classification trees.