In a first approach, all 51 features were used for the tree
construction, including relatively mobile elements such as CaO and
Na![]() O. Therefore, the resulting tree should only be used on fresh
samples of basalt. The largest possible tree (T
O. Therefore, the resulting tree should only be used on fresh
samples of basalt. The largest possible tree (T![]() ) has 51 splits,
and actually uses only 23 of the 51 selected features. These are:
SiO
) has 51 splits,
and actually uses only 23 of the 51 selected features. These are:
SiO![]() , TiO
, TiO![]() , CaO, Fe
, CaO, Fe![]() O
O![]() , MgO, K
, MgO, K![]() O, La, Pr, Nd, Sm, Gd,
Tb, Yb, Lu, V, Ni, Rb, Sr, Y, Hf, Th,
O, La, Pr, Nd, Sm, Gd,
Tb, Yb, Lu, V, Ni, Rb, Sr, Y, Hf, Th, ![]() Sr/
Sr/![]() Sr and
Sr and
![]() Pb/
Pb/![]() Pb. The remaining 28 features apparently did not
contain enough discriminative power. As discussed in Section
2, T
Pb. The remaining 28 features apparently did not
contain enough discriminative power. As discussed in Section
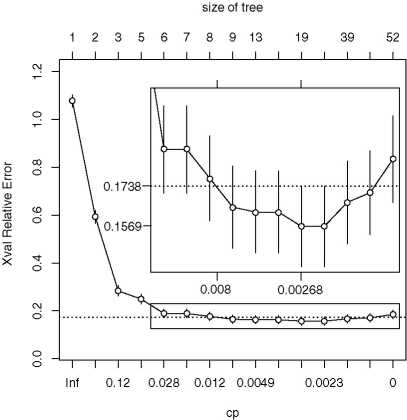
2, T![]() is not the best possible tree. A plot of
relative cross-validation misclassification risk versus tree size
shows a minimum at 18 splits (Figure 3). Using the
1-SE rule then puts the optimal tree size at 8 splits (Figure
3). The resulting, optimally pruned tree is shown in
Figure 4.
is not the best possible tree. A plot of
relative cross-validation misclassification risk versus tree size
shows a minimum at 18 splits (Figure 3). Using the
1-SE rule then puts the optimal tree size at 8 splits (Figure
3). The resulting, optimally pruned tree is shown in
Figure 4.
|
|
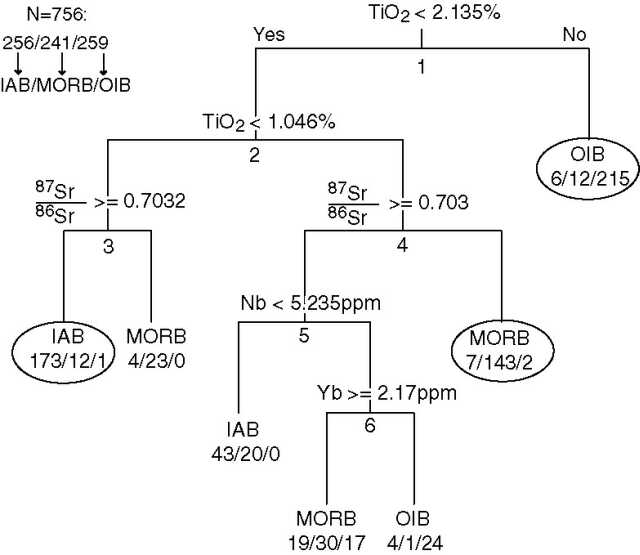
The classification by the optimal tree is remarkably successful. No
less than 79% of all the training data correctly fall in just three
terminal nodes (encircled in Figure 4). Only 7% of
the training data were misclassified, while the ten-fold
cross-validation error is about 11%, corresponding to a success-rate
of 89%. In other words, the probability that a sample of unknown
tectonic affinity will be classified correctly is 89%. The first two
splits (on TiO![]() and Sr) account for 87% of the discriminative
power (Figure 3). In a way, this can be seen as a
justification of the use of these elements in popular discrimination
diagrams such as the Ti-Zr-Sr diagram (Pearce and Cann, 1973). An
analysis of TiO
and Sr) account for 87% of the discriminative
power (Figure 3). In a way, this can be seen as a
justification of the use of these elements in popular discrimination
diagrams such as the Ti-Zr-Sr diagram (Pearce and Cann, 1973). An
analysis of TiO![]() and Sr alone already gives a pretty reliable
classification. For example, if TiO
and Sr alone already gives a pretty reliable
classification. For example, if TiO![]()
![]() 2.135%, the tree tells
us there is a 91% chance that the rock has an OIB affinity.
Likewise, 87% of the training data with TiO
2.135%, the tree tells
us there is a 91% chance that the rock has an OIB affinity.
Likewise, 87% of the training data with TiO![]()
![]() 2.135% and
Sr
2.135% and
Sr![]() 156ppm are MORBs. For further discrimination, additional
elements can be used, which inevitably increases the chance of missing
variables. However, as discussed before, classification trees
elegantly resolve this problem with surrogate split variables, which
are shown in Table 1.
156ppm are MORBs. For further discrimination, additional
elements can be used, which inevitably increases the chance of missing
variables. However, as discussed before, classification trees
elegantly resolve this problem with surrogate split variables, which
are shown in Table 1.
|
|
|