Partial annealing of apatite fission track sample JR2 and complete
annealing of JR1 at ![]() 14 Ma by burial-induced heating alone is
improbable for at least two reasons:
14 Ma by burial-induced heating alone is
improbable for at least two reasons:
An alternative explanation for the vitrinite reflectance and fission
track data is that the Great Valley Group was heated by the
serpentinite diapir. Three lines of evidence suggest that the
serpentinite body was hot when it breached the surface. Most
importantly, mineral assemblages of Franciscan inclusions in the
serpentinite body indicate that it rose from depths of as much as
![]() 20 km which, even under the lowest thermal gradients, would make
them relatively hot (
20 km which, even under the lowest thermal gradients, would make
them relatively hot (![]() 200
200![]() C; Coleman, 1996). Secondly, the
serpentinite diapir rose very rapidly. Evidence for the massive size
and sudden nature of this event is contained in the Middle Miocene Big
Blue Formation, which crops out
C; Coleman, 1996). Secondly, the
serpentinite diapir rose very rapidly. Evidence for the massive size
and sudden nature of this event is contained in the Middle Miocene Big
Blue Formation, which crops out ![]() 15 km east of the serpentinite
dome. The Big Blue Formation consists almost entirely of serpentinite
clasts, some of which are house-sized (Anderson and Pack, 1915).
Paleocurrents indicate flow towards the east, in the opposite
direction of the ``normal'' Great Valley Group paleocurrents (Casey
and Dickinson, 1976; Bate, 1985). The facies gradient from sheared
protrusive serpentinite through braided stream deposits to marine
tidal flat facies evinces an eastward facing paleoslope (Bate, 1985).
The fluvial deposits preserving paleocurrents were shed from the
gradually spreading flank of a New Idria serpentinite protrusion that
breached the suface to form a dome-like mass that spread laterally as
additional serpentinite was supplied to the surface by upward diapiric
flowage from within the crust. If the serpentinite body rose to the
surface extremely rapidly, it is likely to have remained hot all that
time. Finally, serpentinization reactions are exothermic:
15 km east of the serpentinite
dome. The Big Blue Formation consists almost entirely of serpentinite
clasts, some of which are house-sized (Anderson and Pack, 1915).
Paleocurrents indicate flow towards the east, in the opposite
direction of the ``normal'' Great Valley Group paleocurrents (Casey
and Dickinson, 1976; Bate, 1985). The facies gradient from sheared
protrusive serpentinite through braided stream deposits to marine
tidal flat facies evinces an eastward facing paleoslope (Bate, 1985).
The fluvial deposits preserving paleocurrents were shed from the
gradually spreading flank of a New Idria serpentinite protrusion that
breached the suface to form a dome-like mass that spread laterally as
additional serpentinite was supplied to the surface by upward diapiric
flowage from within the crust. If the serpentinite body rose to the
surface extremely rapidly, it is likely to have remained hot all that
time. Finally, serpentinization reactions are exothermic:
Antigorite:
![]()
Chrysotile:
![]()
Both of these reactions require a lot of water. This could be the
reason why the serpentinization did not happen before the Middle
Miocene. At that time, the Mendocino triple junction passed the
latitude of Coalinga. The faulting and folding caused by the San
Andreas fault might have introduced a pathway for fluids in the
ophiolitic crust that underlies the Great Valley Group. Both the
reaction enthalpy ![]() of the serpentinization reactions and the
heat capacity C
of the serpentinization reactions and the
heat capacity C![]() of the serpentinite minerals vary with temperature
(Holland and Powell, 1998). At the conditions relevant to the New
Idria serpentinite dome, the pressure effect is negligible. Making the
simplifying assumption that serpentinization of the entire body
occurred at the same time, we can calcuLate a first-order
approximation of the maximum temperature increase that could be caused
by the serpentinization:
of the serpentinite minerals vary with temperature
(Holland and Powell, 1998). At the conditions relevant to the New
Idria serpentinite dome, the pressure effect is negligible. Making the
simplifying assumption that serpentinization of the entire body
occurred at the same time, we can calcuLate a first-order
approximation of the maximum temperature increase that could be caused
by the serpentinization:
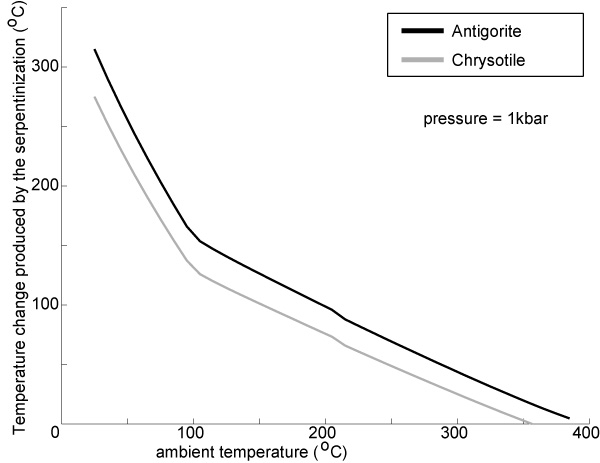 |
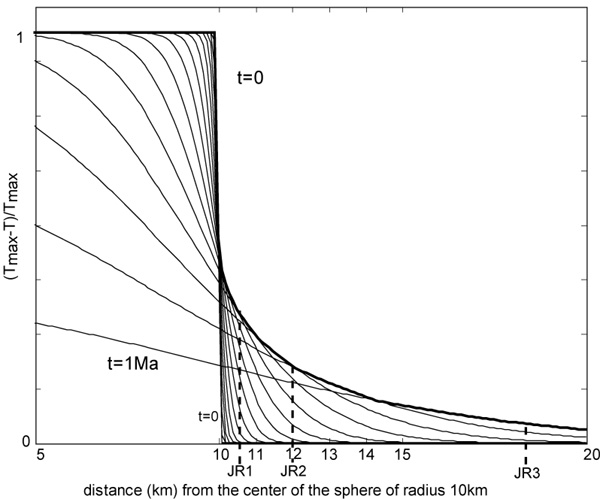
The evolution of this reaction temperature as a function of ambient temperature is shown in Figure 5. The lower the ambient temperature, the more exothermic the serpentinization reactions are, but above a few hundred degrees, they can even become endothermic. The buffering thermodynamics of the serpentinization reactions are such that the serpentinite body must have been hot when it formed, either because the ambient temperature was high or because of its own reaction heat. A rough estimate of the thermal effect that a hot, spherical body the size of the New Idria diapir would have on the adjacent country rock can be calculated assuming simple conductive cooling:

with ![]() the initial temperature difference between the serpentinite
and the country rock, R the radius of the sphere (
the initial temperature difference between the serpentinite
and the country rock, R the radius of the sphere (![]() 10km), r the
distance from the center of the sphere,
10km), r the
distance from the center of the sphere, ![]() the diffusivity
(
the diffusivity
(![]() m
m![]() /s), and t time (modified from Carslaw and Jaeger,
1959). Figure 6 shows the result of this
calculation. It indicates that during
/s), and t time (modified from Carslaw and Jaeger,
1959). Figure 6 shows the result of this
calculation. It indicates that during ![]() 10
10![]() years after the
intrusion of a hot body the size of the New Idria diapir, the rocks
within a few km of the contact would experience a transient heating
spike. Added to the pre-existing background geothermal gradient, this
spike could explain both the vitrinite reflectance data and the
apatite fission track annealing behavior. Thermal halos around
protrusive serpentinite bodies of west-central California have been
described by Murata et al. (1979), who traced the Marca Shale
Member of the Upper Cretaceous and Paleocene petroliferous Moreno
Shale over a distance of 120 km and found that biogenic silica in this
unit was cristobalitic everywhere, except for the northern flank of
Joaquin Ridge, where it comes within less than 1 km of the New Idria
serpentinite body. This is the only place where quartz-phase silica
exists, indicating maximum temperatures
years after the
intrusion of a hot body the size of the New Idria diapir, the rocks
within a few km of the contact would experience a transient heating
spike. Added to the pre-existing background geothermal gradient, this
spike could explain both the vitrinite reflectance data and the
apatite fission track annealing behavior. Thermal halos around
protrusive serpentinite bodies of west-central California have been
described by Murata et al. (1979), who traced the Marca Shale
Member of the Upper Cretaceous and Paleocene petroliferous Moreno
Shale over a distance of 120 km and found that biogenic silica in this
unit was cristobalitic everywhere, except for the northern flank of
Joaquin Ridge, where it comes within less than 1 km of the New Idria
serpentinite body. This is the only place where quartz-phase silica
exists, indicating maximum temperatures ![]() C.
C.
 |
We have not attempted to rigorously model petroleum generation and
trapping in the Vallecitos syncline, but current studies by the United
States Geological Survey may better constrain the petroleum history
(Peters et al., 2005). Nevertheless, various relations provide
general constraints on petroleum generation and accumulation, and thus
provide a point of comparison for our interpretation. Biomarkers
recently collected from the Vallecitos oil field by the United States
Geological Survey show biomarker and isotope compositions indicative
of Upper Eocene Kreyenhagen source rocks (written communication,
Kenneth E. Peters). However, the small pools in the syncline occur
mainly in fault traps located under the Kreyenhagen Formation
(California Division of Oil and Gas, 1982). Therefore, the
Maastrichtian-Danian Moreno Formation might be a more plausible source
of these hydrocarbons. Although not understood in detail, the fault
traps likely developed when the syncline folded in the Late Middle
Miocene (Rentschler, 1985). Thus, maturation, migration and entrapment
likely occured no earlier than Late Miocene, consistent with our data
and interpretation.