From the archive of apatite fission-track samples at ETH-Zürich,
we chose a sample that was both rapidly cooled and full of large
mineral inclusions. The sample, NAX-3, comes from the migmatite core
on the eastern side of Naxos. In fact, apatites from NAX-3 contain so
many inclusions that it was quite challenging to date them using the
fission-track method. Due to the U bearing inclusions which form
``stars'' on the mica solid state track recorders (Figure
8), clear grains had to be chosen with care.
Nevertheless, a fission-track age of 9.5 ![]() 1.8 (2
1.8 (2![]() ) was
measured using the
) was
measured using the ![]() (zeta) calibration method (Hurford and
Green, 1983) (Figure 9.a). The U-concentration of
the apatites was determined to be
(zeta) calibration method (Hurford and
Green, 1983) (Figure 9.a). The U-concentration of
the apatites was determined to be ![]() 20 ppm. Two additional zircon
fission-track ages were recorded by Zingg (2004) from the same
migmatite at 9.7
20 ppm. Two additional zircon
fission-track ages were recorded by Zingg (2004) from the same
migmatite at 9.7 ![]() 1.0 and 10.6
1.0 and 10.6 ![]() 2.0 Ma (2
2.0 Ma (2![]() )
confirming the rapid cooling.
)
confirming the rapid cooling.
|
a. 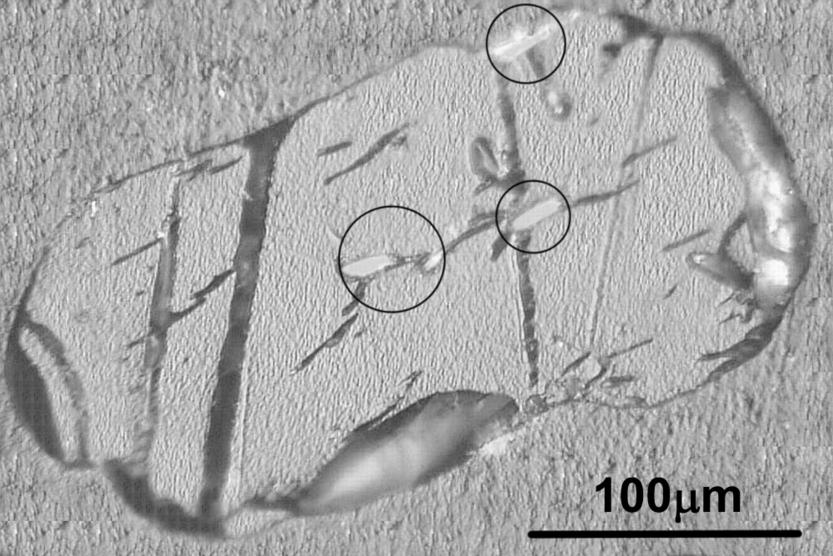 b.
b. 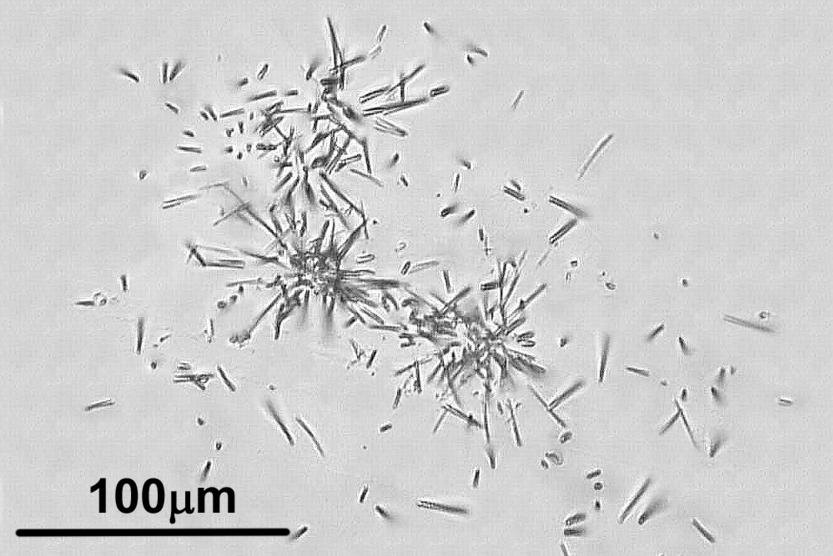
|
|
a. 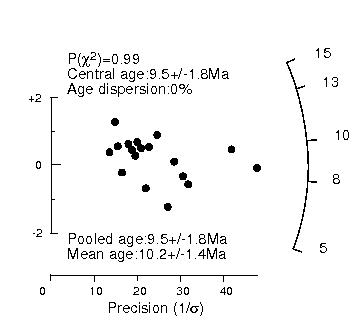 b.
b. 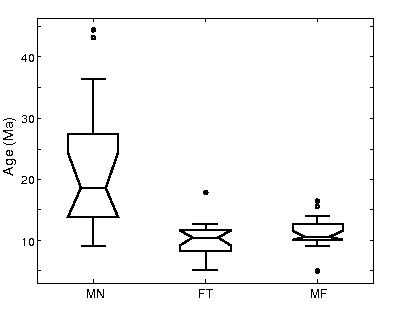
|
Inspection under a binocular microscope (200![]() magnification)
revealed that most inclusions are zircon, based on crystal shape and
reflectance (Figure 10). Zircons are the ``right'' kind of
inclusion for the present study, because they are particularly hard to
dissolve. After measuring their size under the microscope for the
calculation of F
magnification)
revealed that most inclusions are zircon, based on crystal shape and
reflectance (Figure 10). Zircons are the ``right'' kind of
inclusion for the present study, because they are particularly hard to
dissolve. After measuring their size under the microscope for the
calculation of F![]() , the apatites were packed in Pt foil tubes. Two
batches of grains were prepared: 26 single grain packets and 7
multi-grain packets with inclusion-bearing apatites (labels beginning
with ``M'' in Table 1) and four multi-grain packets with
inclusion-free apatites (labels beginning with ``Z'' in Table
1).
, the apatites were packed in Pt foil tubes. Two
batches of grains were prepared: 26 single grain packets and 7
multi-grain packets with inclusion-bearing apatites (labels beginning
with ``M'' in Table 1) and four multi-grain packets with
inclusion-free apatites (labels beginning with ``Z'' in Table
1).
|
a. 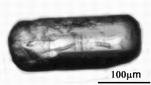 b.
b. 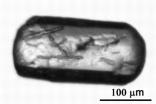 c.
c. 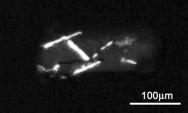
|
Helium contained in the apatites was extracted during 3 minutes of
laser heating under ultra-high vacuum (10![]() Torr), using a 1064
nm wavelength Nd-YAG laser. Re-extraction experiments yielded no
detectable helium, indicating complete degassing. Following its
release from the samples, the gas was cleaned in a liquid N
Torr), using a 1064
nm wavelength Nd-YAG laser. Re-extraction experiments yielded no
detectable helium, indicating complete degassing. Following its
release from the samples, the gas was cleaned in a liquid N![]() cooled
activated charcoal cold finger and Ti/Zr and Al/Zr getters.
cooled
activated charcoal cold finger and Ti/Zr and Al/Zr getters. ![]() He was
measured by peak height calibration to a bottle of known amounts of
He was
measured by peak height calibration to a bottle of known amounts of
![]() He in a custom-built sector-type mass spectrometer. After
He-analysis, the Pt packets were recovered from the laser pan,
partially opened under the binocular microscope, and dropped into
teflon bombs. Because Pt dissolves in HF and forms PtAr interferences
in the ICP-MS plasma (Reiners, 2005), we had to recover the Pt packets
before HF treatment. Using Nb foil envelopes would have been an
alternative solution (Reiners, 2005). In nearly half of the cases,
dropping the samples into the teflon bombs caused the apatite(s) to
fall out of their partially opened packet. These grains were
specifically selected for later HF-treatment in order to avoid
complications of PtAr interferences. First however, all samples were
spiked with
He in a custom-built sector-type mass spectrometer. After
He-analysis, the Pt packets were recovered from the laser pan,
partially opened under the binocular microscope, and dropped into
teflon bombs. Because Pt dissolves in HF and forms PtAr interferences
in the ICP-MS plasma (Reiners, 2005), we had to recover the Pt packets
before HF treatment. Using Nb foil envelopes would have been an
alternative solution (Reiners, 2005). In nearly half of the cases,
dropping the samples into the teflon bombs caused the apatite(s) to
fall out of their partially opened packet. These grains were
specifically selected for later HF-treatment in order to avoid
complications of PtAr interferences. First however, all samples were
spiked with ![]() 50 fmol of
50 fmol of ![]() U and
U and ![]() 20 fmol of
20 fmol of
![]() Th.
Th. ![]() 1 ml of concentrated and high purity
quartz-distilled HNO
1 ml of concentrated and high purity
quartz-distilled HNO![]() was added to all the samples. After
digestion on a hot plate (
was added to all the samples. After
digestion on a hot plate (![]() 150
150![]() C) for one day, the HNO
C) for one day, the HNO![]() was
dried down for the inclusion-free and half of the inclusion-bearing
samples, and
was
dried down for the inclusion-free and half of the inclusion-bearing
samples, and ![]() 1 ml of 6%HNO
1 ml of 6%HNO![]() -0.8%HF solution was added. For
these samples (labels beginning with ``MN'' and ``ZN'' in Table
1), this was the final sample preparation step before
the U-Th measurement. For the remaining 19 inclusion-bearing samples
(labels beginning with ``MF'' in Table 1), the empty
Pt-packets were recovered from the teflon vials prior to evaporation
of the concentrated HNO
-0.8%HF solution was added. For
these samples (labels beginning with ``MN'' and ``ZN'' in Table
1), this was the final sample preparation step before
the U-Th measurement. For the remaining 19 inclusion-bearing samples
(labels beginning with ``MF'' in Table 1), the empty
Pt-packets were recovered from the teflon vials prior to evaporation
of the concentrated HNO![]() . After dry-down,
. After dry-down, ![]() 1 ml of
concentrated, high purity Teflon-distilled HF was added and the
samples were bombed in an oven at 200
1 ml of
concentrated, high purity Teflon-distilled HF was added and the
samples were bombed in an oven at 200![]() C for 24 hours and on a hot
plate at
C for 24 hours and on a hot
plate at ![]() 240
240![]() C for an additional 48 hours.
C for an additional 48 hours. ![]() 100
100 ![]() l
of concentrated HNO
l
of concentrated HNO![]() was added to the HF for samples MF16-19,
following a suggestion of P. Reiners (written communication, May
2006). The HF was dried down and the samples re-bombed in
was added to the HF for samples MF16-19,
following a suggestion of P. Reiners (written communication, May
2006). The HF was dried down and the samples re-bombed in ![]() 1 ml
concentrated HCl at
1 ml
concentrated HCl at ![]() 200
200![]() C for 24 hours to dissolve fluoride
salts that may have formed during HF evaporation. After a final
dry-down,
C for 24 hours to dissolve fluoride
salts that may have formed during HF evaporation. After a final
dry-down, ![]() 1 ml 6%HNO
1 ml 6%HNO![]() -0.8%HF solution was added and the
samples were ready for ICP-MS analysis. This combined HNO
-0.8%HF solution was added and the
samples were ready for ICP-MS analysis. This combined HNO![]() -HF-HCl
treatment is tailored to dissolve larger crystals for zircon (U-Th)/He
dating (Reiners, 2005). However, zircons inclusions in apatite are
generally much smaller, and a less aggressive (e.g., shorter, less
hot) procedure
might also be suitable.
-HF-HCl
treatment is tailored to dissolve larger crystals for zircon (U-Th)/He
dating (Reiners, 2005). However, zircons inclusions in apatite are
generally much smaller, and a less aggressive (e.g., shorter, less
hot) procedure
might also be suitable.
![]() Th,
Th, ![]() Th,
Th, ![]() U,
U, ![]() U (and
U (and ![]() U) were
measured in low mass resolution on a single-collector ICP-SF-MS
(Element2, Thermo Electron Corporation, Bremen, Germany). The results
are summarized in Table 1. Immediate inspection of the
data reveals that the spread of the zircon inclusion-bearing grain
ages is much larger for the HNO
U) were
measured in low mass resolution on a single-collector ICP-SF-MS
(Element2, Thermo Electron Corporation, Bremen, Germany). The results
are summarized in Table 1. Immediate inspection of the
data reveals that the spread of the zircon inclusion-bearing grain
ages is much larger for the HNO![]() treated grains than for those
treated with HF (Figure 9.b). The former are up to
45 Ma old, whereas the latter cluster more tightly and are closer to
the fission-track age. Using the grain dimensions that were measured
for the
treated grains than for those
treated with HF (Figure 9.b). The former are up to
45 Ma old, whereas the latter cluster more tightly and are closer to
the fission-track age. Using the grain dimensions that were measured
for the ![]() -ejection correction as an estimate of mass yields
median U and Th concentrations of
-ejection correction as an estimate of mass yields
median U and Th concentrations of ![]() 5 and
5 and ![]() 10ppm for the
HNO
10ppm for the
HNO![]() -treated grains, whereas the U and Th concentrations of the
HF-treated grains was
-treated grains, whereas the U and Th concentrations of the
HF-treated grains was ![]() 6 and
6 and ![]() 14ppm respectively, closer to
the fission track estimate (
14ppm respectively, closer to
the fission track estimate (![]() 19ppm). 10 of the 14 HF-treated
single grain samples are between 9 and 13 Ma, consistent with the
sharp mode of Figure 4. As discussed in the previous
section, the average age of multiple inclusion-bearing apatites should
be an accurate estimate of the true age. To compare and combine the
single grain measurements with the multi-grain measurements, we
introduce a ``pooled (U-Th)/He age'', which effectively is a weighted
mean age obtained by adding the U and Th of several individual
analyses, as well as their He-content (weighted for
19ppm). 10 of the 14 HF-treated
single grain samples are between 9 and 13 Ma, consistent with the
sharp mode of Figure 4. As discussed in the previous
section, the average age of multiple inclusion-bearing apatites should
be an accurate estimate of the true age. To compare and combine the
single grain measurements with the multi-grain measurements, we
introduce a ``pooled (U-Th)/He age'', which effectively is a weighted
mean age obtained by adding the U and Th of several individual
analyses, as well as their He-content (weighted for
![]() -ejection), and calculating a synthetic multi-grain age. The
pooled age of the HNO
-ejection), and calculating a synthetic multi-grain age. The
pooled age of the HNO![]() -treated inclusion-bearing grains is 22.6 Ma,
whereas the HF-treated pooled age is 10.9 Ma, which is identical to
the pooled (U-Th)/He age of the four inclusion-free apatite analyses.
Note that the (U-Th)/He age of one of these four inclusion-free ages
is nearly twice as old as the other three. Because we have no
indication as to what is the cause of this, we chose not to reject the
measurement. However, if the measurement is removed as being
unrepresentative the resulting age is 9.2 Ma. Fitzgerald et al.
(2006) also observed single grain ages that were several times older
than ``normal''. Perhaps one of the factors discussed by these
authors is responsible for this, or a yet unknown complication is at
work. As discussed in Section 3 and shown in Figure
5, the spread of HF-treated multi-grain samples
should be less than that of the single grain ages. The relative
2
-treated inclusion-bearing grains is 22.6 Ma,
whereas the HF-treated pooled age is 10.9 Ma, which is identical to
the pooled (U-Th)/He age of the four inclusion-free apatite analyses.
Note that the (U-Th)/He age of one of these four inclusion-free ages
is nearly twice as old as the other three. Because we have no
indication as to what is the cause of this, we chose not to reject the
measurement. However, if the measurement is removed as being
unrepresentative the resulting age is 9.2 Ma. Fitzgerald et al.
(2006) also observed single grain ages that were several times older
than ``normal''. Perhaps one of the factors discussed by these
authors is responsible for this, or a yet unknown complication is at
work. As discussed in Section 3 and shown in Figure
5, the spread of HF-treated multi-grain samples
should be less than that of the single grain ages. The relative
2![]() -spread of multi-grain packages each containing ten
inclusion-bearing grains of 100
-spread of multi-grain packages each containing ten
inclusion-bearing grains of 100 ![]() m width (equivalent to S/R
m width (equivalent to S/R ![]() 0.2) should be less than
0.2) should be less than ![]() 8 % (Figure 5).
This is confirmed by the five multi-grain measurements of Table
1 (MF15-19), which have a 2
8 % (Figure 5).
This is confirmed by the five multi-grain measurements of Table
1 (MF15-19), which have a 2![]() -spread of just 5%.
-spread of just 5%.